May 27, 2020
Architecture AI Project
Visualizing Heatmap of Architectural Costs
Architectural Cost Heatmap
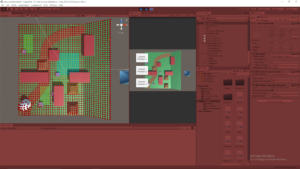
I was just using basic black cubes to visualize the grid of nodes in the AGrid A* system originally. Now I finally decided to update that system with a bit more information by adding a colored heatmap to map out the architectural values of the nodes. This will help me understand the pathing of my agents better as they start to use these values in more complex and interesting ways.
Basic Heatmap Color System
It turns out making a heatmap color scale that decently ranges between values of 0.0 and 1.0 is pretty easy. Using HSV color values, you can just vary the H (hue) value while keeping the other two values constant at 1.0 to cover a heatmap spectrum (where H of 0.0 is the lowest value in the range, 1.0 is the highest value in the range, and all other colors are bound within that range). By simply using the min and max architectural values possible in the system as the range bounds I could easily set this type of system up.
Applying Colors to Visualization
For now I decided to just apply this heatmap color methodology to the cubes mapping out the A* grid for now. While these gizmo cubes used to just be colored black for simplicity, now they are colored according to the heatmap color system using the architectural value found within the node.
Bug: Influence Objects Found to Radiate Improperly
The influence objects which apply architectural values to the nodes around them were initially designed to apply in an area around them, with the objects in the center. After applying the heatmap, it was clear that the influence objects were not applying to the nodes intended. It appears the influence actually uses the position of the influence object as the bottom left corner, and radiates upward and to the right (so just in the positive x and z direction away from the object). This is something I will have to look into to make sure it’s an issue with the influence objects, and not the coloring system.

