
Architecture AI Reading CSV File Data to Use in Node Grid
June 8, 2020
Architecture AI Project
Read CSV File
General Goal
For this architecture project we wanted to be able to read data exported from other softwares into Unity. Initially we will be using data from Rhino, but it will be converted to a very generic format (like .csv), so it should be more widely applicable. This data will be used as another way to inform the node system and assign architectural values to these nodes which will again be used to inform the decisions of the agents traveling with the node system.
Using Text Data in Unity
Our text files will be very simplistic, so we can use a very straight forward approach to organizing and using the data from the text files. Each line of data is important for a single node, so splitting on a line will help organize individual node information. Then we just have to split up the information within that line to spread the information out to the proper variables within the node.
Both of these actions can be handled with a string array created from using the Split method at a specific character. Split() is a method within the String class which allows you to easily create separate strings from a single string that is split at a certain location. To create the separate lines of data, the strings are split on the new line character (‘n’), where as when we are splitting up the data within a single line, we split the string on the comma character (‘,’). This specifically works here since we are dealing with .csv files.
This approach pretty easily parsed out the .csv data for me in string format to start using with the node system.
Visualizing Proper .csv Data Distribution on Nodes
I wanted a way to effectively assess and debug whether the system was working properly or not, so I decided to use my node visualization approach I have used for other values already. Using my heat map coloring system for the node visualizer, I just want to visualize the nodes in accordance with their connectivity values (which will be fully applied by the .csv file and the file reader alone).
Actually Applying .csv Data to the Nodes in Grid
This process is much more difficult to find a solution which is quick and somewhat efficient. The original thought of just searching and matching locations blindly would take a very long time every time a grid was initialized, so using the organization of the data to assign these more efficiently will be key.
Approach #1:
Since the .csv data is organized by coordinates in a way similar to how the grid is built in the first place, it made sense to just fill the Node data in from the .csv file data as the grid was built. As long as the .csv data is incremented in a way to continually match the new node positions, this should work rather well.
Issues:
The .csv data is not perfectly rectangular. It does not have values at all for areas where there are gaps or holes, which the node grid does, so it is not just a 1:1 ratio of .csv data points and nodes
Solutions:
- To keep the data aligned, I am using a check to make sure the current Node having its values assigned matches the coordinates within the current chunk of .csv data looking to be assigned
- If they match, assign the architectural value (connectivity in testing) and increment the .csv data counter
- If they do NOT match, do NOT assign the value and do NOT increment the .csv data counter
- This helps hold on to the .csv data until the proper node is found
- This must be done very carefully however as if they ever get out of sync, it will basically just stop assigning data forever (because it will just continually wait until the proper node is found)
- Keeping array indices correct for both sets of arrays is paramount for this system to work
- The Grid nodes start at 0 and go to (maxDimension – 1)
- The File nodes start at 1 and go to (maxDimension)
- The Grid is fully rectangular, where as the File skips coordinates where there is no data
- Keeping all this in mind, this was the check to keep the arrays straight and assign the proper values to the proper location:
- Just adding 1 to both the x and y dimensions of the grid units makes sure they are in line with the proper data found in the .csv value
- The dataCounter value keeps track of which row of data to use (which actually ends up reaching the total number of .csv file data nodes (Roughly close to the number of Grid nodes unless there are a lot of gaps))
- Then the second dimension of the fullData array is simply just the columns of data within the .csv file (so for this basic case, there are only 4 columns)
- The data from the fullData columns for x and y coordinates are used for the check, then the last column is where the actual value is found that is assigned to the node if the correct one was found
- The dataCounter is only incremented IF data was actually set
- This keeps it on the same chunk of data until the proper grid node is found to assign it
Images of Data Visualized
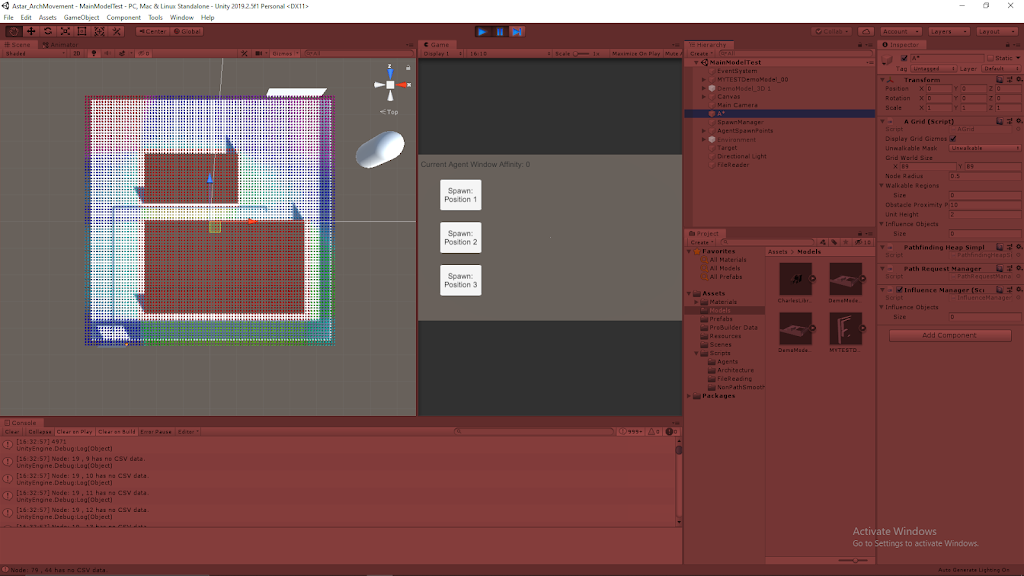
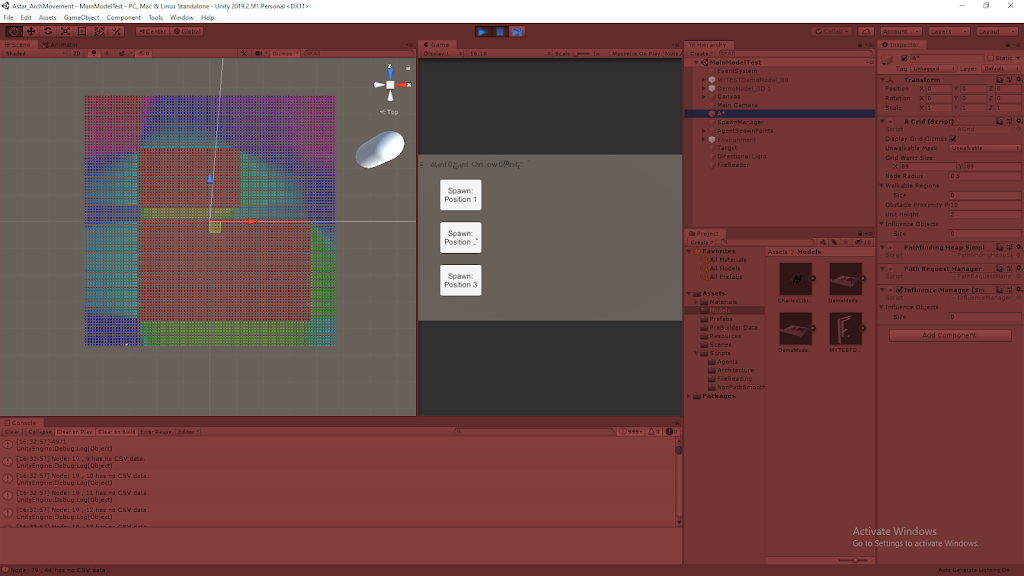
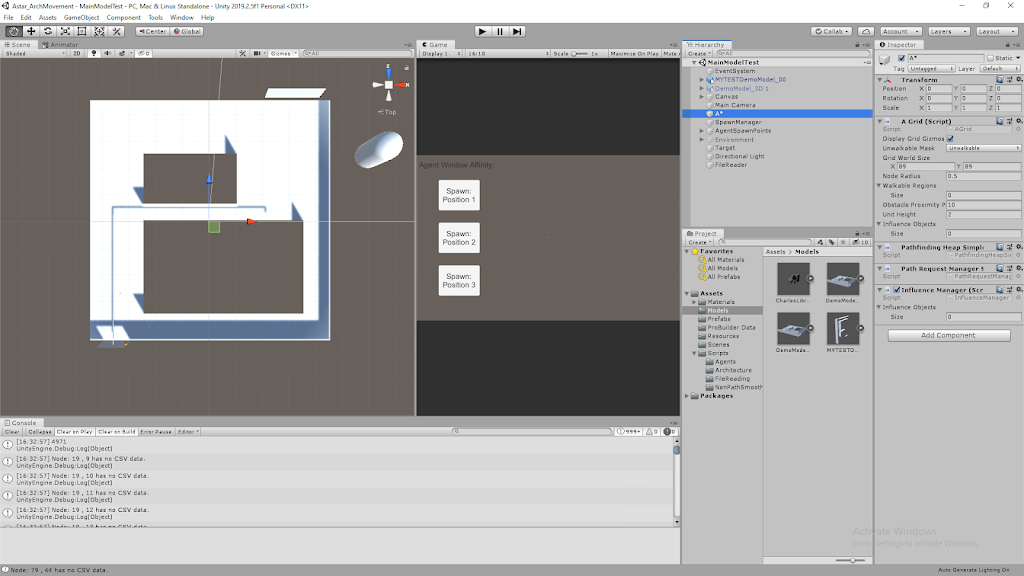
I was able to pass the connectivity data from Rhino into Unity through a .csv file and properly apply that data to the same relative locations within Unity. I overlayed this data with the model that was originally used to generate the data in Rhino, in Unity. I passed the connectivity values into the properly associated nodes as determined by the Rhino .csv value, and then visualized these values on the nodes by coloring them with a heat map-like approach.
I am still using a very basic heat map coloring system that isn’t super clear as the color system I use is cyclical (which means values that are very low and very high both appear reddish), but the images at least show the general idea pretty well. It also shows the gaps are being picked up properly as connectivity values are clearly not assigned there (giving them their base value of 0 which is very low, making those nodes red).
Summary / Moving Forward
While this is a good start, it will stay take a lot of work to make the overall system more automated. For example, even this process of keeping the nodes in line with the .csv data is a bit forced because this only works by making the grid have the same dimensions as the .csv data. Further development could help account for cases where you want to scale the system and have more nodes than data points or vice-a-versa.
The models are currently using U.S. units (feet) where as Unity inherently works on the metric system (meters). This immediately presented a bit of a scaling difference just to make sure the data matched up with the actual virtual model. This can make matching everything up exactly a bit tricky because the node system works on an integer system and you can only have whole numbers of nodes, but perfectly matching these systems can result in some fractional values when converting between units, which can end up adding some extra node data around the edges that just isn’t accounted for.