Architecture AI Pathing Project: Selecting Spawn and Target Positions from Objects in the Model

November 23, 2020

Spawning and Pathing System

Architecture AI Project


Updated Spawning System to Use Objects within Model as List of Options

We wanted to update the spawning system so that instead of being arbitrary points, both the spawn location and target location were tied to objects that could be found throughout the entire model. The system is already creating a list of all the objects within the model for applying colliders and various other components, so that could be accessed for this purpose as well. This list of objects was then put into a UI dropdown for selecting both the spawn position and the target position. The transform of the selected object was then used for that respective part of the pathing.

Highlighting the Spawn and Target Locations

I wanted to highlight both the spawn and target objects to make it more apparent where the agents would be aiming to path. The first implementation I went with for now changes the material of the object. The spawn object becomes an orange color, and the target object becomes a green color. This however is not very clear with many objects, because some such as windows and doors are within the walls, which are hard to see from the angle we are using currently. I will be exploring better options such as spawning an extra object or UI element around the area to make it more apparent.

Example Images Showing a Few Paths with Varied Spawn and Target Positions

Next Step

We want to determine how we want to narrow down the list of options to select as spawn and target locations since we generally will not need access to every single object. We have to decide how flexible the options need to be, as the more rigid it will be the more we can automate it and narrow the options down to a select few.

via Blogger http://stevelilleyschool.blogspot.com/2020/11/architecture-ai-pathing-project_23.html

Architecture AI Pathing Project: Automating the Sizing of the Node Grid

November 17, 2020

Automated Node Grid Size

Architecture AI Project


Title:
Unity Bounds Documentation

By:
Unity


Unity – Informational

Description:
Unity’s documentation on their Bounds class and its methods.


Automating Process of Sizing the Node Grid

The A* pathing uses an underlying grid of nodes to inform the agents how to move through an area. A value must be input to tell the grid how large of an area to cover with these nodes. Originally these values, which are two dimensions of a rectangular area, had to be input manually. Since this grid will always be covering a full architectural model, it made sense to be able to access the model and automate the sizing process through the size of the model.

Encapsulate Bounds of All Children Objects

Since we are dealing with models in Unity, I looked to the Bounds class to help with automating this grid creation process. Immediately, Bounds can be used to find the bounding volume of a single mesh/renderer/collider. The architectural models however are complex models made up of many children models, including both small elements like windows and entire structural elements like the walls. Needing to create bounds that made sure they contained every bit of the architecture, I created a method which looks through all the children of the overall parent architectural model object and uses the Bounds.Encapsulate method to continually increase the size of a single bounds reference until it contains the entirety of the model.

Using Bounds for Sizing

After creating a set of bounds which encompassed the proper area of interest, they needed to be used to set the node grid. The Bounds.Size property returns a Vector3 which gives the dimensions of said bounding box. Because of our current frame of reference, we could use Bounds.size.x and Bounds.size.z to find our two dimensions for our 2D node grid area.

The following image shows an example model with the created bounding box around it (shown as a yellow wire box). The node grid can be seen as all the small red cubes. It can somewhat be seen that the node grid is about the size of the bounding box using the above approach, but it is still tied to the origin since the repositioning logic has not been added yet.

Example of Model Bounding Box with Resized Node Grid

Next Step

The size gives us the dimensions of the node grid, but to fully automate it it still needs to find the proper position of the node grid. Just for now the node grid is still starting at Unity’s origin and building out from there, regardless of the position of the model. Positioning the grid will either use Bounds.center to find the center of the model and build out from there, or Bounds.min or Bounds.max to find one corner of the model and build out from there. Either of these options should give similar results.

via Blogger http://stevelilleyschool.blogspot.com/2020/11/architecture-ai-pathing-project.html

Architecture AI Pathing Project – System Manager and Automating Component Application to Imported Models

October 29, 2020

Automating Component Application and System Manager

Architecture AI Pathing Project


System Manager and Initialization

The integration of several classes and adding more has started to create a lot of necessary references becoming difficult to time properly. To make sure a certain class has already initialized or some other class has performed its Awake() method I end up making extra references and method calls within other classes so the proper references are set before peroforming those methods.

In an effort to organize this better and make the timing more understandable, I am looking at making a SystemManager gameobject to replace the DemoManager, and either add an Initialization class to this or make it its own class if it does not require being a monobehaviour. This Initialization class will be responsible for calling all the major system classes initialization methods in the proper order to ensure references are met. This will also require moving some Awake and Start methods from other classes to some Initialization method.

This could also be a good case for an interface dealing with initialization. I could then make all the major system classes implement this interface and then plug them into an Initialization Manager class that calls each of the interface implementing objects’ Initialization methods.

Automating Component Application to the Imported Architecture Models

To make the system more user friendly, the more it can automate the better. The system uses Influence objects as the basis of many of the architectural elements applying their effects to the surrounding area, but these are components that must be added to the objects themselves. Since the objects are coming in as part of a large scale model from software like Revit or 3DS Max, they have nothing on them ahead of time. Right now specific objects need to manually be found and have the proper components applied, so we would like to automate that process.

Approach 1 – Gather All Children of Imported Models and Apply Components and Layers by Name

The first approach I will try involves manually adding a reference to an imported model object in Unity’s inspector, and this will give the new class (named ApplicatorManager) a reference to create a gameobject list of all the children objects. From here, ApplicatorManager can go through each object and check if its name contains a certain string to determine which objects to apply the designated layers and components to.

To create this connection of strings and components or layers, I am creating a new small data class called Applicator. This will hold: a string (search term to look for in names of objects), an enum (either “component” or “layer” to determine which thing it will be adding), and either an Influence object (for component) or a layer integer value (for layer). The ApplicatorManager will have an array of these Applicator objects which the designer can add/remove from in the Inspector and fill in the search term, whether that should add a component or layer, and which one for each element in the array.

Summary

I think organizing all of the initialization processes for the several main system core classes will be beneficial for controlling the reference timings as well as thinning out some of the larger classes. The Applicator approach I am looking at adding may not be terribly efficient, but it only needs to be run once at the start of setting up a model each time so it will be good for getting the connections setup for now. Since I am looking at a component application method, it could be worth looking into an option that can do this in the Unity editor so it only needs done once a model is imported and not each time the project is actually run. This could be a good way for reducing load times of the system.

via Blogger http://stevelilleyschool.blogspot.com/2020/10/architecture-ai-pathing-project-system.html

Architecture AI Prototype Historical Path Visualization and UI Updates

July 1, 2020

Architecture AI Project

Added Path Visualization and UI Updates

Introduction

To top off the prototype, we added a quick visualization tool to show any paths that agents have taken within the current game session. This was necessary to make it easier to compare the paths of various combinations of agents and environments even. Along with this, some elements of modifying the system that were only accessible within the Unity Inspector have been moved to the in game UI. This makes it much more manageable to alter the agents and their pathing for Unity users and non-users alike.

The following quick reference image shows an example of this new path visualization tool (the red line going through the diagonal of the area).

Reference for New Path Visualization Tool (the Red Line is the Path)

Vimeo – My Demo of the Past Path Visualization Tool (with New UI Elements)

Past Path Visualization Feature

Visualization

The path data was already being recorded in an in-depth manner for storing the data in a text format for export, so here we just focused on using that data during the game session to provide another useful data visualization tool. This data is kept as an array of Node objects, which in turn individually hold information on their world position. This provided a solid foundation to visualize the information again.

The array of Nodes could then provide me with an array of world positions which I could use with Unity’s line renderer to create a basic line connecting all of these points. Using the line renderer component also leaves the tool flexible through the Inspector to modify how the line is drawn to fit different needs or environments.

Dropdown UI

To make this easy to access for the user, I added a Unity dropdown UI element to the scene to hold information about all the past paths. It initializes by creating a newly cleared dropdown and adding a simple “None” option which helps keep everything in line, as well as providing the user an obvious spot to go back to when they don’t want to show any previous paths. Then as paths are generated, more options are added to this dropdown to keep it in line with all the paths created (this also keeps their indices in sync for easy reference between the dropdown and the recorded paths).

Added UI Elements for Operating System

As a prototype tool, a quick way to allow for tweaking values and controlling assets is to just use public variables or Unity tool assets (like Unity Ranges and enums within the scripts). This became even cumbersome for myself, so it could be a large issue and slow down for less savvy Unity users. This made me want to explore moving some of these parameters into the game UI for easier use.

Agent Affinity Sliders

I looked into creating Unity UI sliders and since there were pretty easy to implement I moved the range sliders from the Unity Inspector for setting the different agent affinities for the next spawned agent to the game UI. This was straightforward in that the slider values could almost directly be transferred to the spawnmanager (The slider actually goes between values of 0.0 – 1.0 and is multiplied by the max affinity value of the system to properly stay constrained within that range).

Agent Pathing Type Dropdown

After exploring the dropdowns for the path history visualization tool, I also decided to use them for determining the path type of the next spawned agent. This allows the user to quickly choose between different architectural types to use to calculate the agent’s pathing.

Since the architectural types are within a public enum, the dropdown could be populated by the ToString() versions of this entire enum (which can be cycled through in C#). Since they are populated this way in order based on the enum itself, the dropdown can inform the PathFindingHeapSimple (the class that needs to know the type in order to determine which pathing calculations to use) based on the enum index number. They should be kept in sync based on the way the dropdown is created.

Summary

The past path visualization tool is very useful for comparing paths a bit more quickly (since changing values for individual paths can take a small bit of time). It may help in the future of the project to visualize multiple paths at once to directly compare paths very easily. The system also displays information about the path it is showing so the user knows better why the path is the way it is.

Unity’s UI elements are pretty easy to work with, and adding methods to their OnValueChanged delegate is a very nice and consistent way of only calling changes/methods specifically when a UI element is modified. This was perfect for both the dropdowns and the sliders since they only need to invoke change within the system when their values are changed. This keeps them a bit cleaner and more efficient.

The UI elements are strongly tied to the borders of the screen using the standard Unity positioning constraint system, so it can look really messy at smaller resolutions. It operates well enough since there’s not too much going on, so just allocating a decent resolution to the window when using it at least shows everything which is the most important aspect for a prototype.

Architecture AI Completed Prototype with Data Visualization and Pathing Options

June 24, 2020

Architecture AI Project

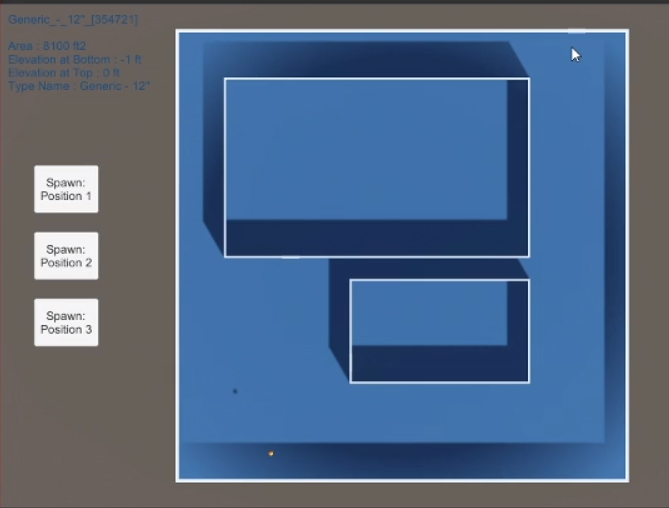
Completed Project Prototype

Introduction

We were exploring different methods for importing architectural models into Unity and decided to try Revit to see what it had to offer. The models are easy to move between softwares, and it also creates .cs scripts that Unity can use to provide some interactive data visualization when using the Revit models.

Data Visualization Options

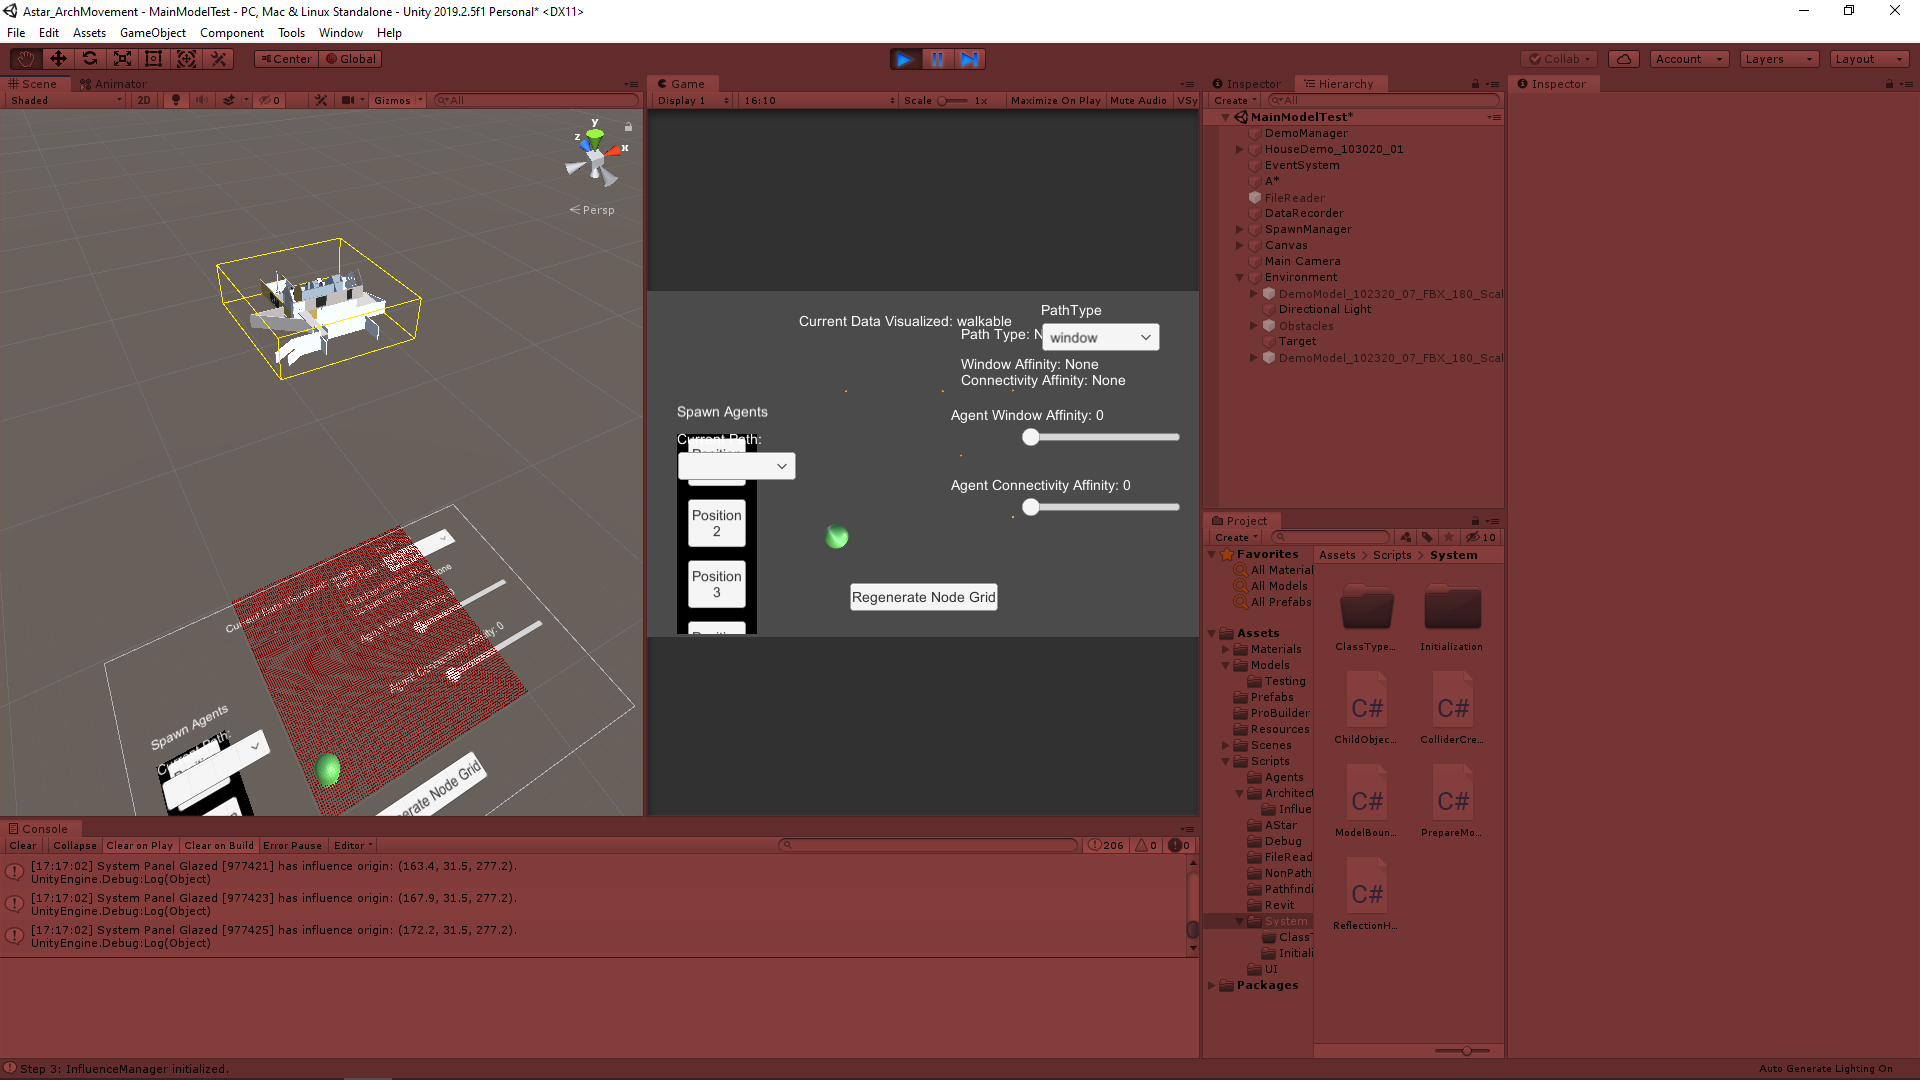
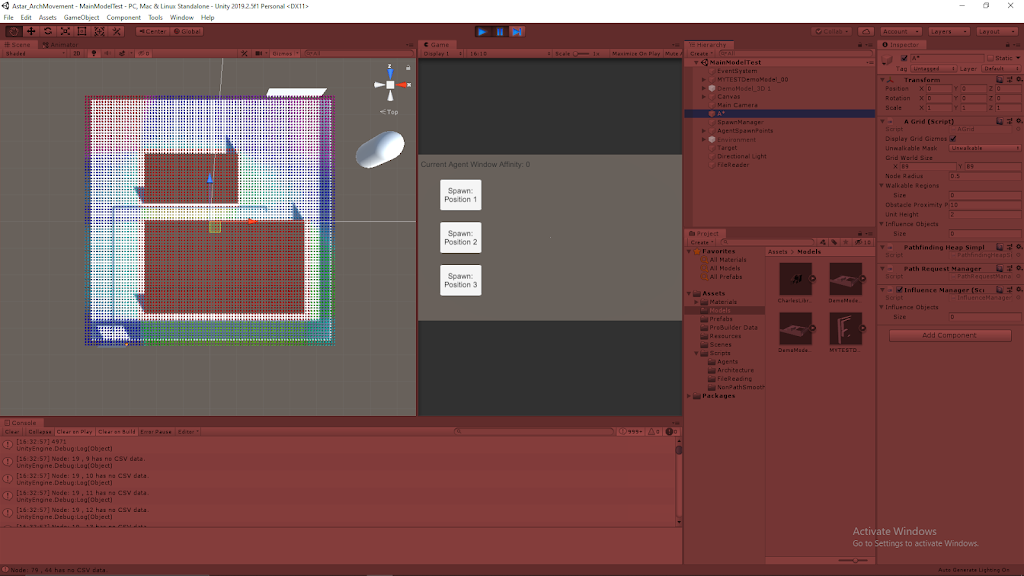
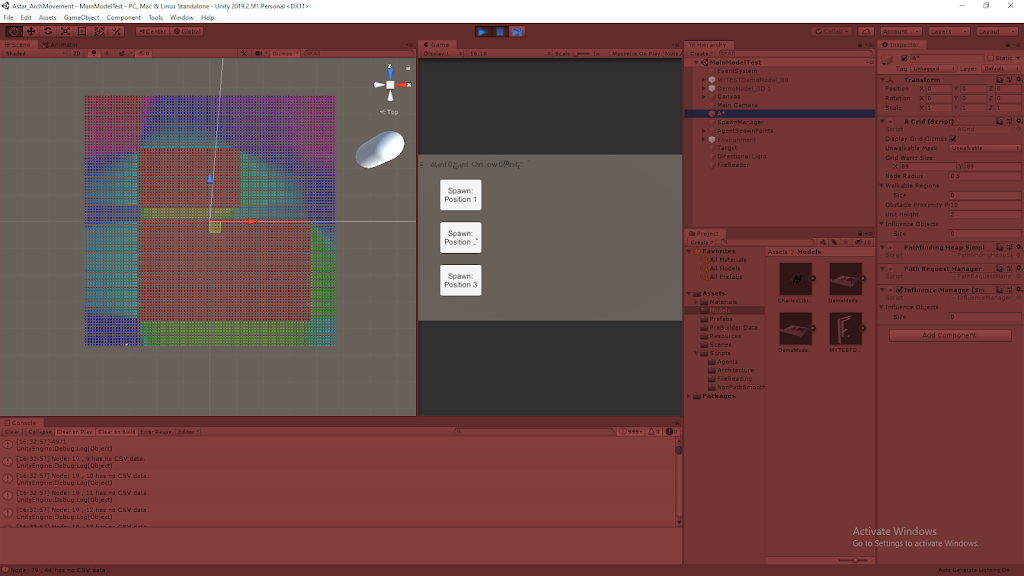
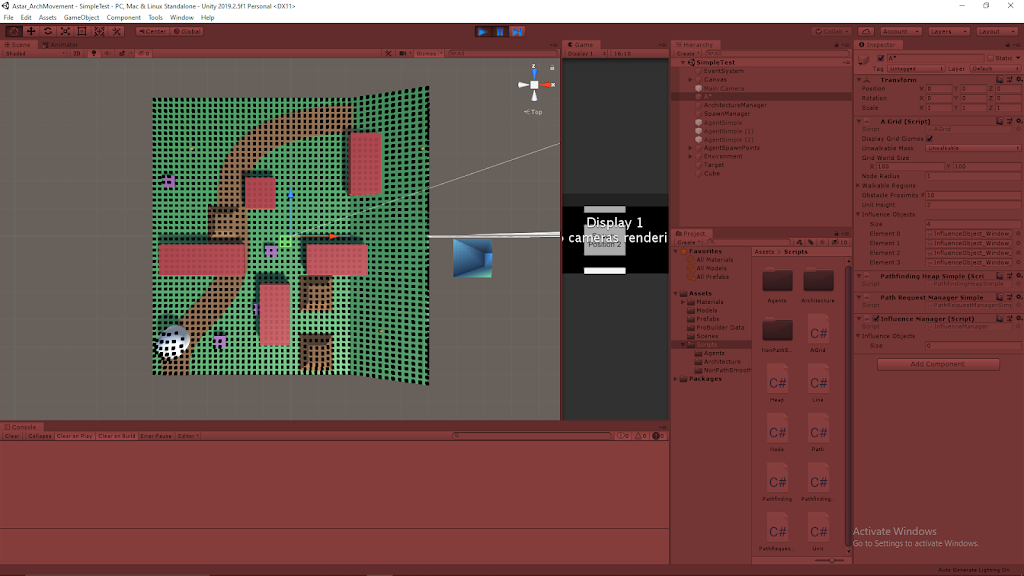
I moved everything dealing with the major logic of the A* grid node visualization into its own class named AStarGridVisualization. This allowed me to continue to hold on to all the different debug visualization methods I created over the course of the project and convert them into a list of options for the designer to use for visualization purposes.

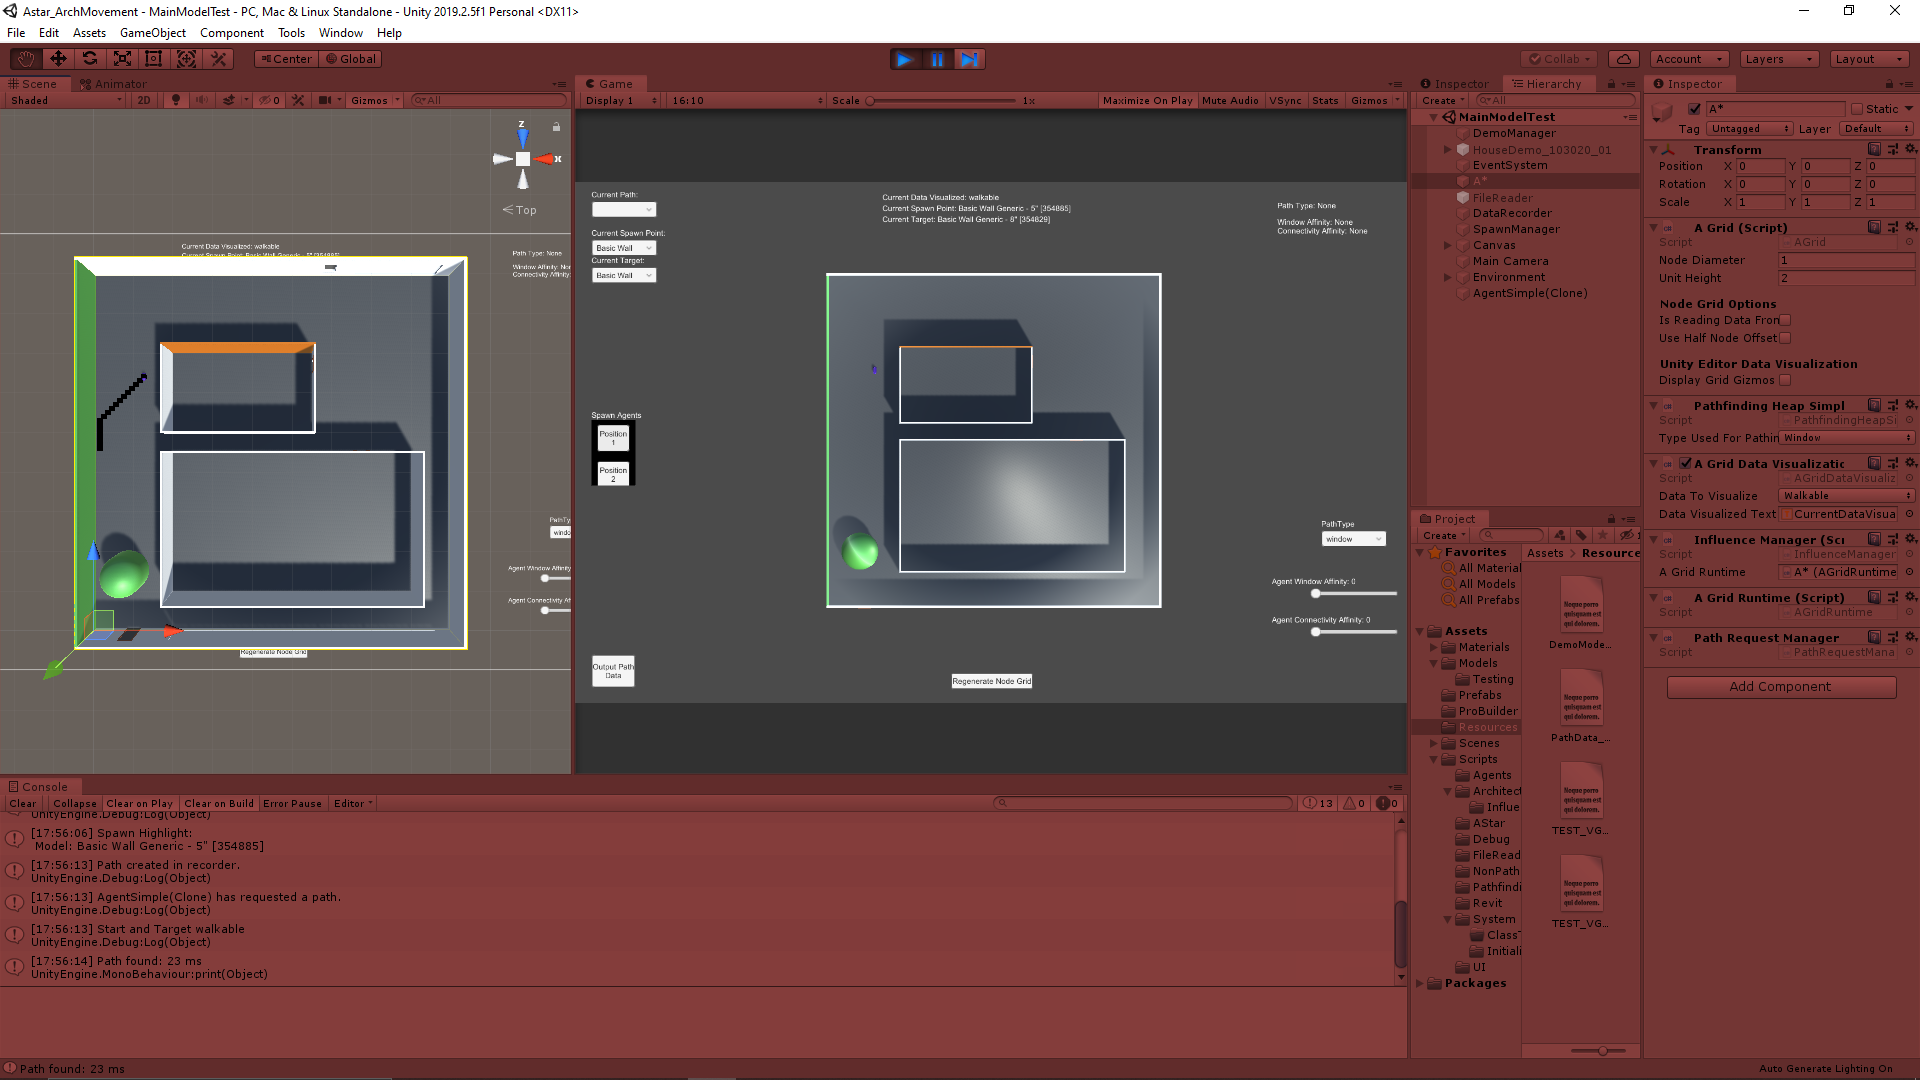
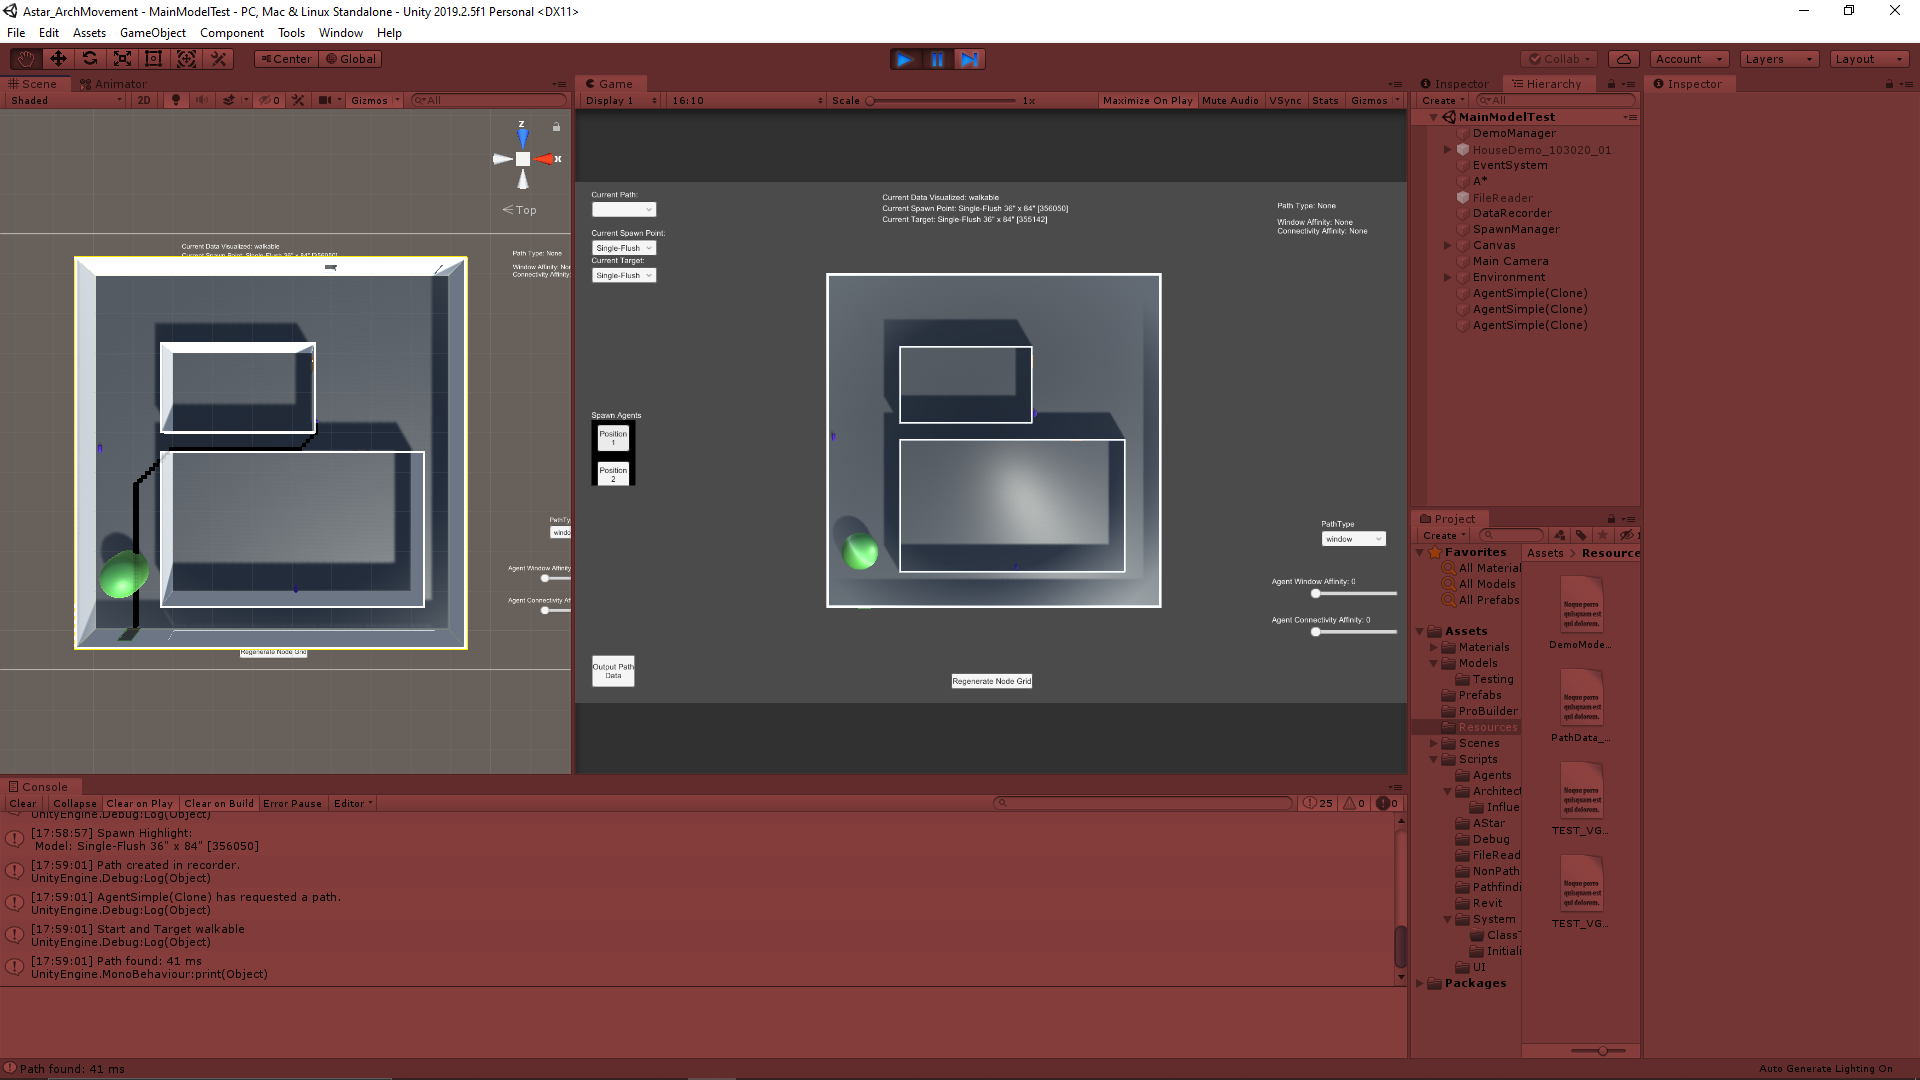
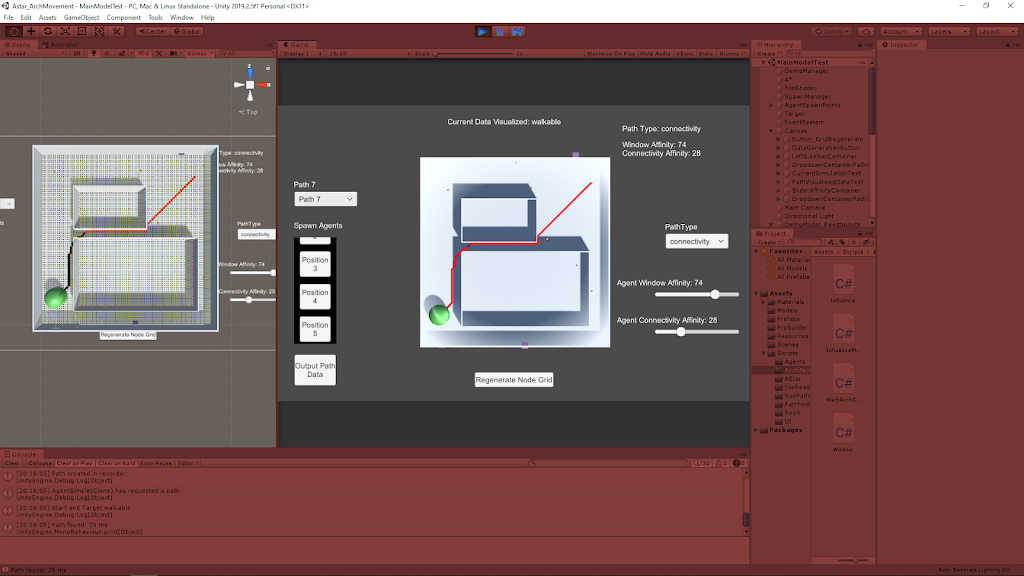
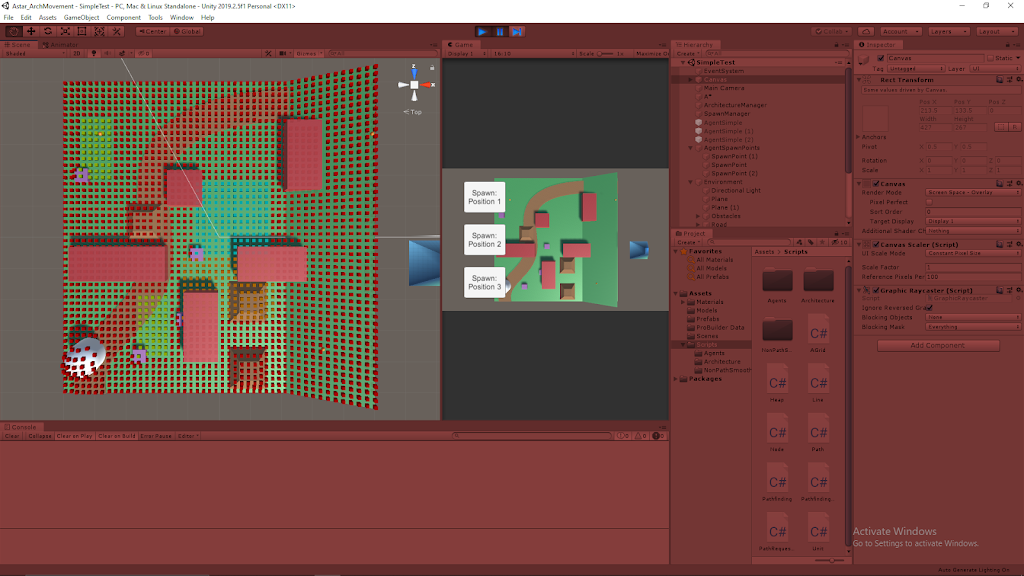
As can be seen in the demo, there is a list of options in the drop down list in the Unity Inspector so the designer can tell the system which data to visualize from the nodes. The options currently available are: Walkable, Window, and Connectivity. Walkable shows which nodes are considered walkable or not. Window and Connectivity show a colored heat map to show those respective values within the nodes themselves.

Changing Values Used for Pathing

The project wanted to be able to use different types of values to see their effects on the agents’ pathing, so every node has several different types of architectural values (i.e. Window and Connectivity). Using the window information for pathing will give different agent paths than when using the connectivity values, because the agents have different affinities towards these types of values and the nodes have different values for these different types contained within the same node.

The PathFindingHeapSimple class handles the calculations for the costs of the paths for the agents, so I have also located the options to switch between pathing value checks here. This class is responsible for checking nodes and their values to see which lead to the lowest cost paths, so there is another drop down list available to the designer here that determines which architectural value type these checks look at when looking at the nodes. This allows the designer to choose which architectural value actually influences the agents’ paths.

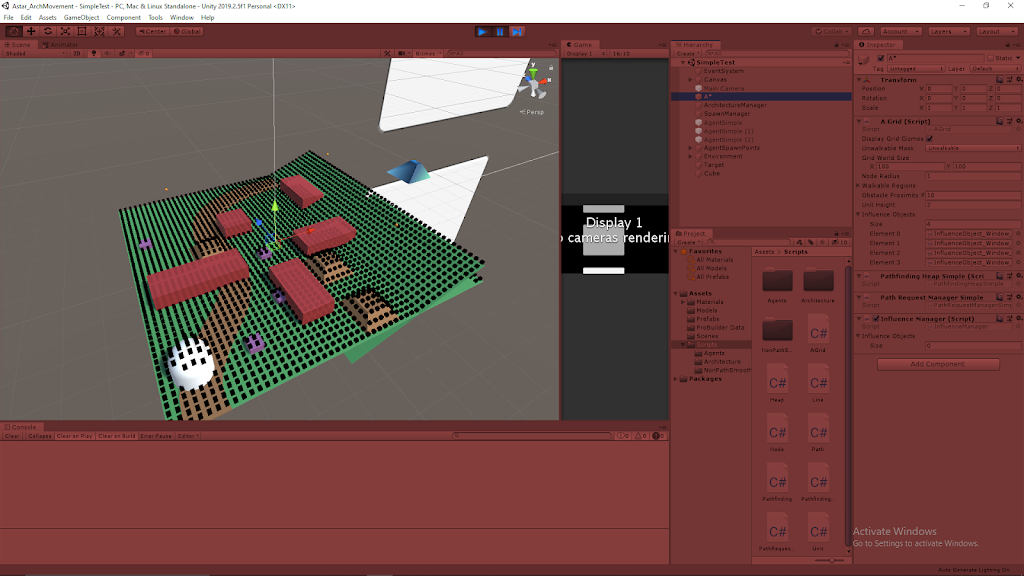
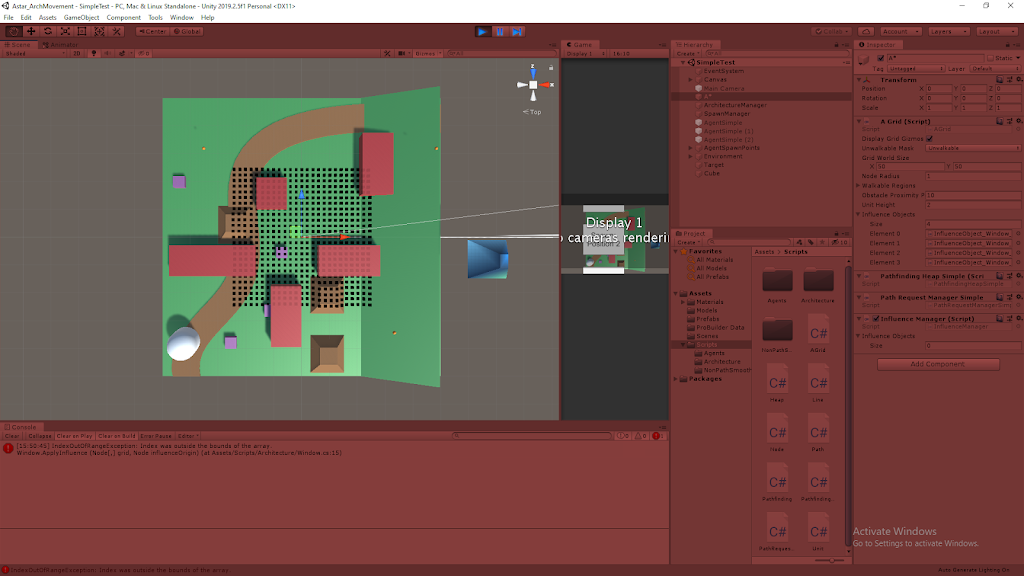
A* Node Grid Construction Options

This point of the project was still working with various types of model imports from various softwares to find which worked the best and most consistent, so I added some extra options for generating the node grid in the first place to give some quick options that may better help line up the node coverage area with the model at hand. These major options located in the AGrid class itself are: GridOriginAtBottomLeft and UseHalfNodeOffset (the third is determining whether the system reads data from a file or not to add values to the node grid, but that’s a more file oriented option).

GridOriginAtBottomLeft

GridOriginAtBottomLeft determines where Unity’s origin is located relative to the node grid. When true, Unity’s origin is used as the bottom left most point of the entire node grid. When false, Unity’s origin is used as the central point of the generated node grid.

UseHalfNodeOffset

UseHalfNodeOffset is responsible for shifting the nodes ever so slightly to give a different centering option for the nodes. When true, half of the dimension of an individual node is added to the positioning vector of the node (in x and z) so that the node is centered within the coordinates made by the system. When false, the offset is not added, so the nodes are directly located exactly at the determined coordinates.

File Reading to Set Values Within Nodes

There are two major ways to apply architectural values to the nodes: using architectural objects (within Unity itself) or reading data from a file. The data files contain x and y coordinate information along with a value for a specific architectural value for many data points throughout a space. These files can be placed Unity’s Assets/Resources folder to be read into the system. The option referenced above in the AGrid to read data from a file or not is the IsReadingDataFromFile bool, and it just tells the system whether or not to check the file told to the system to assign values to the grid.

The FileReader object holds the CSVReader class which deals with the logic of actually reading this file information. The name of the file to be read needs to be inserted here (by copy/paste generally to make sure it is exact), and the dimensions of the data should be manually assigned at this time to make sure the system gets all of the data points and assigns them to the grid appropriately (these data dimensions are the “x dimensions” and “y/z dimensions” ranges of the coordinates within the data).

Demonstration of Prototype

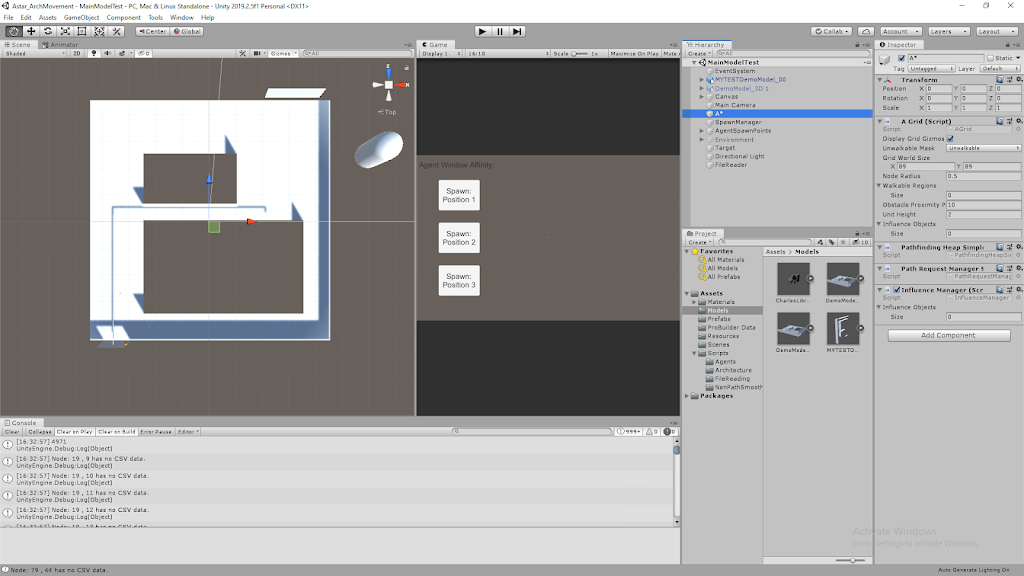
This demonstration helps show the different data visualization options of the grid, the agent spawning system, how changing the architectural value path type changes the agents’ paths, and how a lot of these systems look in the Unity Inspector.

Vimeo – Architecture AI Project Prototype Demonstration

Summary

I really liked a lot of the options I was able to add to help increase the project’s overall usability and make it much easier to switch between various options at run time to test different setups. The end product is meant to help users that may not have a lot of Unity experience, so I tried to reduce the learning curve by making a lot of options easily accessible with visible bools and drop down lists, while also providing some simple buttons in the game space to help with some other basic actions (such as spawning new agents).

Many of the classes were constructed with scalability and efficiency in mind, so expanding the system should be very doable. However much of this scalability is still contained within the programming itself and the classes themselves would need to be modified to add more options to the system at this point (such as new architectural types). This is something I would like to make more accessible to the designer so that it’s intuitive and possible to modify without programming knowledge.

The file reading system works well enough for these basic cases, but it could definitely use some work to be more flexible and work with various node grid options. This is something I could use more work on in general, and having systems to read in files and output files to record data would be useful to understand better in general.

Architecture AI Working with Revit Models and Scripts in Unity

June 15, 2020

Architecture AI Project

Revit Models in Unity

Introduction

We were exploring different methods for importing architectural models into Unity and decided to try Revit to see what it had to offer. The models are easy to move between softwares, and it also creates .cs scripts that Unity can use to provide some interactive data visualization when using the Revit models.

Parameters Import Script

This script creates a large list of strings. It does so by receiving an identification looking string, and uses a method to convert that string into its corresponding parameter information.

Example:

private string ParamByName(string d)
{
switch(d)
{
case “Generic_-_12″_[354721]”:
d = “Area : 8100 ft2 nElevation at Bottom : -1 ft nElevation at Top : 0 ft nType Name : Generic – 12″ n”;
break;


}

return d;
}

Parameter Mouse Over Script

This script uses the name of this.gameObject to add information to the parameter list. The names of all the individual parts of the Revit model correspond to all the input strings found in the ParametersImport partner script. This shows that we most likely need to place this script on every piece of the model individually (since it’s only adding the one name of this.gameObject).

Adding this script to each individual gameObject present in the Revit model got it working. When mousing over the individual parts, it highlights that part with a color and displays some text information about that piece.

Revit In Unity Example

My Example Image of Revit Model with Mouse Over Parameters Shown

The following link shows an example of me using a Revit model in Unity with the corresponding scripts to get the Mouse Over action working.

My Showcase of Revit Model and Scripts

Summary

This is a nice included data visualization tool that can be included essentially for free. The information it provides could possibly be helpful, but the scripts are also very simple so they could easily be tweaked to include other information. All the information is also included in strings within the scripts already, so that data could possibly be extruded for other uses (if that turns out to be an easier way to get said data).

Architecture AI Reading CSV File Data to Use in Node Grid

June 8, 2020

Architecture AI Project

Read CSV File

General Goal

For this architecture project we wanted to be able to read data exported from other softwares into Unity. Initially we will be using data from Rhino, but it will be converted to a very generic format (like .csv), so it should be more widely applicable. This data will be used as another way to inform the node system and assign architectural values to these nodes which will again be used to inform the decisions of the agents traveling with the node system.

Using Text Data in Unity

Our text files will be very simplistic, so we can use a very straight forward approach to organizing and using the data from the text files. Each line of data is important for a single node, so splitting on a line will help organize individual node information. Then we just have to split up the information within that line to spread the information out to the proper variables within the node.
Both of these actions can be handled with a string array created from using the Split method at a specific character. Split() is a method within the String class which allows you to easily create separate strings from a single string that is split at a certain location. To create the separate lines of data, the strings are split on the new line character (‘n’), where as when we are splitting up the data within a single line, we split the string on the comma character (‘,’). This specifically works here since we are dealing with .csv files.
This approach pretty easily parsed out the .csv data for me in string format to start using with the node system.

Visualizing Proper .csv Data Distribution on Nodes

I wanted a way to effectively assess and debug whether the system was working properly or not, so I decided to use my node visualization approach I have used for other values already. Using my heat map coloring system for the node visualizer, I just want to visualize the nodes in accordance with their connectivity values (which will be fully applied by the .csv file and the file reader alone).

Actually Applying .csv Data to the Nodes in Grid

This process is much more difficult to find a solution which is quick and somewhat efficient. The original thought of just searching and matching locations blindly would take a very long time every time a grid was initialized, so using the organization of the data to assign these more efficiently will be key.

Approach #1:

Since the .csv data is organized by coordinates in a way similar to how the grid is built in the first place, it made sense to just fill the Node data in from the .csv file data as the grid was built. As long as the .csv data is incremented in a way to continually match the new node positions, this should work rather well.

Issues:

The .csv data is not perfectly rectangular. It does not have values at all for areas where there are gaps or holes, which the node grid does, so it is not just a 1:1 ratio of .csv data points and nodes

Solutions:

  • To keep the data aligned, I am using a check to make sure the current Node having its values assigned matches the coordinates within the current chunk of .csv data looking to be assigned
    • If they match, assign the architectural value (connectivity in testing) and increment the .csv data counter
    • If they do NOT match, do NOT assign the value and do NOT increment the .csv data counter
    • This helps hold on to the .csv data until the proper node is found
    • This must be done very carefully however as if they ever get out of sync, it will basically just stop assigning data forever (because it will just continually wait until the proper node is found)
  • Keeping array indices correct for both sets of arrays is paramount for this system to work
    • The Grid nodes start at 0 and go to (maxDimension – 1)
    • The File nodes start at 1 and go to (maxDimension)
    • The Grid is fully rectangular, where as the File skips coordinates where there is no data
  • Keeping all this in mind, this was the check to keep the arrays straight and assign the proper values to the proper location:
if ((node.gridX + 1) == fullData[dataCounter, 1] && (node.gridY + 1) == fullData[dataCounter, 2])
{
            node.Connectivity = fullData[dataCounter, 3];
            dataCounter++;
        }

    • Just adding 1 to both the x and y dimensions of the grid units makes sure they are in line with the proper data found in the .csv value
    • The dataCounter value keeps track of which row of data to use (which actually ends up reaching the total number of .csv file data nodes (Roughly close to the number of Grid nodes unless there are a lot of gaps))
    • Then the second dimension of the fullData array is simply just the columns of data within the .csv file (so for this basic case, there are only 4 columns)
    • The data from the fullData columns for x and y coordinates are used for the check, then the last column is where the actual value is found that is assigned to the node if the correct one was found
    • The dataCounter is only incremented IF data was actually set
      • This keeps it on the same chunk of data until the proper grid node is found to assign it

Images of Data Visualized

I was able to pass the connectivity data from Rhino into Unity through a .csv file and properly apply that data to the same relative locations within Unity. I overlayed this data with the model that was originally used to generate the data in Rhino, in Unity. I passed the connectivity values into the properly associated nodes as determined by the Rhino .csv value, and then visualized these values on the nodes by coloring them with a heat map-like approach.
I am still using a very basic heat map coloring system that isn’t super clear as the color system I use is cyclical (which means values that are very low and very high both appear reddish), but the images at least show the general idea pretty well. It also shows the gaps are being picked up properly as connectivity values are clearly not assigned there (giving them their base value of 0 which is very low, making those nodes red).

View #1: Node Visualization Over Model

View #2: Node Visualization (without Model)

View #3: Model (without Node Visualization)

Summary / Moving Forward

While this is a good start, it will stay take a lot of work to make the overall system more automated. For example, even this process of keeping the nodes in line with the .csv data is a bit forced because this only works by making the grid have the same dimensions as the .csv data. Further development could help account for cases where you want to scale the system and have more nodes than data points or vice-a-versa.
The models are currently using U.S. units (feet) where as Unity inherently works on the metric system (meters). This immediately presented a bit of a scaling difference just to make sure the data matched up with the actual virtual model. This can make matching everything up exactly a bit tricky because the node system works on an integer system and you can only have whole numbers of nodes, but perfectly matching these systems can result in some fractional values when converting between units, which can end up adding some extra node data around the edges that just isn’t accounted for.

Architecture AI Varied Agent Affinities with Varied Pathing

May 28, 2020

Architecture AI Project

Varied Agent Affinities with Varied Pathing

Demonstration of Varied Agent Affinities with Varied Pathing

Vimeo Link – My Demo of Agents Pathing with Varied Affinities

Explaining Simple but Unclear Heatmap Coloring System

Just to help explain since I don’t have great UI in to explain everything currently, the first thing was that I was testing a really rough “heat map” visual for the architectural values for now. When you turn on the option to show the node gizmos now, instead of uniform black cubes showing all the nodes, the cubes are colored according to the architectural value of the node (for this test case, the window value) Unfortunately this color system isn’t great, especially without a legend, but you can at least see it’s working (I just need to pick a better color gradient). Red is unfortunately both values at/near 0 (min) as well as at/near 100 (max) (but the value range here is only from 0 – 80, so all red in this demo is 0).

Agent Affinity/Architectural Value Interaction for Pathing

The more exciting part is that the basis of the agent affinity and architectural value interactions seem to be working and affecting their pathing in a way that at least makes sense. Again just for demo purposes so far, as can be seen in the video (albeit a bit blurry), I added a quick slider on the inspector for the Spawn Manager to determine the “Window Affinity” for the next agent it spawns (for clarity I also added it as a text UI element that can be seen at the top of the Game View window). Just to rehash, this has a set range between 0 and 100, where 0 means they “hate” windows and avoid them and 100 means they “adore” windows and gravitate towards them.

Test #1: Spawn Position 1

As can be seen in the first quick part of the demo, I spawn 2 agents from the same position 1 but with different affinities. The first has an affinity of 0, and the second has an affinity of 100. Here you can already see the 0 affinity agent steers towards the left side of the large wide obstacle to avoid the blue (relatively high) window area, where as the 100 affinity agent goes around the right side of the same obstacle, preferring the high window valued areas in the blue marked zone.

Test #2: Spawn Position 2

Both the 0 affinity and 100 affinity agents take very similar path, differing by only a couple node deviations here and there. This makes sense as routing around the large high window value area would take a lot of effort, so even the window avoidant agent decides to take the relatively straight forward path over rerouting.

Test #3: Spawn Position 3

This test demonstrated similar results to that of Test #1. The 100 affinity agent moved up and over the large obstacle in the southern part of the area (preferring the high window value area in the middle again), where as the 0 affinity agent moved below the same obstacle and even routed a bit more south just to avoid some of the smaller window afflicted areas as well.

Summary

I did some testing of values in between 0 and 100 and with the low complexity of the area so far, most agents ended up taking one of the same paths as the 0 or 100 affinity agents from what I saw. This will require more testing to see if there already exists some variance, but if not, this suggests that some of the hardcoded behind the scenes values or calculations for additional cost may need tweaked (as is expected). Overall though, the results came out pretty well and seem to make sense. The agents don’t circle around objects in a very odd way, but they also do not go extremely out of there way to avoid areas even when they don’t like them.

Architecture AI Heatmap of Architectural Costs

May 27, 2020

Architecture AI Project

Visualizing Heatmap of Architectural Costs

Architectural Cost Heatmap

I was just using basic black cubes to visualize the grid of nodes in the AGrid A* system originally. Now I finally decided to update that system with a bit more information by adding a colored heatmap to map out the architectural values of the nodes. This will help me understand the pathing of my agents better as they start to use these values in more complex and interesting ways.

Basic Heatmap Color System

It turns out making a heatmap color scale that decently ranges between values of 0.0 and 1.0 is pretty easy. Using HSV color values, you can just vary the H (hue) value while keeping the other two values constant at 1.0 to cover a heatmap spectrum (where H of 0.0 is the lowest value in the range, 1.0 is the highest value in the range, and all other colors are bound within that range). By simply using the min and max architectural values possible in the system as the range bounds I could easily set this type of system up.

Applying Colors to Visualization

For now I decided to just apply this heatmap color methodology to the cubes mapping out the A* grid for now. While these gizmo cubes used to just be colored black for simplicity, now they are colored according to the heatmap color system using the architectural value found within the node.

Bug: Influence Objects Found to Radiate Improperly

The influence objects which apply architectural values to the nodes around them were initially designed to apply in an area around them, with the objects in the center. After applying the heatmap, it was clear that the influence objects were not applying to the nodes intended. It appears the influence actually uses the position of the influence object as the bottom left corner, and radiates upward and to the right (so just in the positive x and z direction away from the object). This is something I will have to look into to make sure it’s an issue with the influence objects, and not the coloring system.

Current Heatmap System (with Bugged Influence Ranges)

AGrid Inspector Breakdown for A* Pathfinding

May 5, 2020

A* Pathfinding

AGrid Inspector Breakdown

Display Grid Gizmos:
determines whether or not to run gizmo methods (methods used for debugging and visualization in the editor, like the node locations)
Unwalkable Mask:
this is the Unity layer that is deemed unwalkable to the system (the layer which are picked up by the nodes during raycasting)
Grid World Size:
a Vector2 which determines the real world size area to attempt to place nodes on (rectangular shaped with alterable width and height)
Node Radius:
half the real world size of each individual node, which correlates to half the distance between each node’s center (in both the x and z direction)
Walkable Regions:
this section can be opened and various terrain types can be added to this as well as their associated movement cost penalties to make certain terrains more or less navigable (also picked up in the raycast of the nodes)
Obstacle Proximity Penalty:
adds a bit of extra cost to nodes right around obstacles to make agents less likely to run right up against (or right inside) of obstacles
Unit Height:
currently used in conjunction with system placing the nodes at the proper elevation to place nodes slightly above the terrain so that using those location as waypoints for the agents does not make them go through/below the ground
Influence Objects:
variable sized array that can be filled with Influence objects so system knows which Influence objects to apply when filling out node values

Example Images of AGrid System and Inspector Designer Tools

Fig. 1: Visualize Nodes (Black Cubes are Node Centers)

Fig. 2: Visualize Nodes (Perspective)

Fig. 3: Visualize Nodes (Smaller Grid to Show Control)

Fig. 4: Additional Sketches to Show Parameter Influence